
The 13-Week Cash Flow Forecast: How to Build One (and What a Lender Reads in It)
Your bank balance tells you where you are. It does not tell you whether payroll clears in week seven. The 13-week forecast is the one tool built to answer that question, and it is the document a lender asks for when liquidity gets tight.
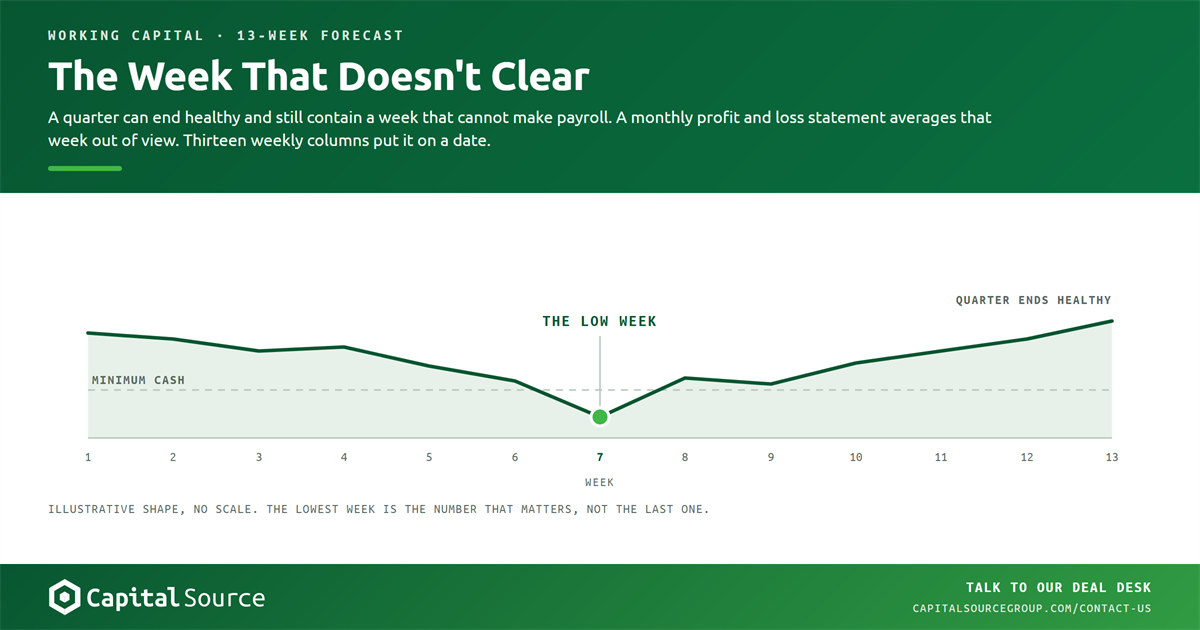
Most owners we know can quote last month’s revenue to the dollar and today’s bank balance to the penny, and still cannot say with confidence what their cash position looks like nine weeks from now. That is not a discipline problem. It is a tooling problem. A monthly profit and loss statement was never built to answer a weekly question, and the businesses that get caught short are rarely the unprofitable ones. They are the ones who could not see a specific Friday coming.
The 13-week cash flow forecast fixes that. It is not a complex model, and building one does not require a finance team. What it requires is a willingness to work from dates instead of averages.
What is a 13-week cash flow forecast?
A 13-week cash flow forecast is a week-by-week projection of the cash a business expects to actually receive and actually pay out over the coming quarter, built from expected receipts and disbursements rather than from accounting profit. Thirteen weeks is simply one fiscal quarter: 13 weeks of seven days is 91 days. The window is long enough to reveal a trough forming and short enough that the assumptions still rest on things you already know, like which invoices are outstanding and when payroll runs.
The model uses what accountants call the direct method. As Wall Street Prep describes it, “the 13-week cash flow uses the direct method to forecast weekly cash receipts less cash disbursements.” Financial Edge Training frames the same approach as one that “distils all activities of a firm down to cash receipts and cash disbursements.”
That is the whole idea. Money in, money out, by week, on the dates it actually moves.
Why does it use cash receipts instead of net income?
Because net income answers a different question. Profit tells you whether the work you did was worth doing. Cash tells you whether you can meet an obligation on a particular Tuesday. Those two answers diverge constantly, and the gap between them is where most liquidity surprises live.
The alternative construction, the indirect method, starts at net income and reconciles backward to cash. That is what most accounting software produces by default. Under US accounting standards the direct method is actually the encouraged presentation: ASC 230-10-45-25 encourages entities to use it, though as Deloitte’s guidance on ASC 230 notes, “many entities apply the indirect method to present operating cash flows.”
For year-end reporting, that choice is largely a matter of convention. For forecasting, it is the whole game. An indirect view tells you that cash moved. A direct view tells you when it moved, who sent it, and who it went to. Only one of those can warn you about week seven.
How much runway does a small business actually have?
Less than most owners assume. The JPMorgan Chase Institute, working from 597,000 small businesses, defined a cash buffer day as “the number of days of cash outflows a business could pay out of its cash balance were its inflows to stop.” The median small business held 27 of them. A quarter of businesses held fewer than 13. The spread across industries was wide, from 16 days for restaurants to 47 days for real estate.
The median small business holds 27 cash buffer days, and roughly a quarter hold fewer than 13, according to the JPMorgan Chase Institute’s analysis of 597,000 small businesses.
That research drew on 2015 transaction data and was published in 2016, so treat the precise figures as a baseline rather than a current reading. The direction has not changed. In the Federal Reserve’s 2025 Report on Employer Firms, 51% of small employer firms named uneven cash flow as a financial challenge in the prior 12 months.
Sit with the arithmetic for a moment. Twenty-seven days is under four weeks. A 13-week forecast covers roughly three times the median company’s entire margin for error. Most owners are steering with a headlight that reaches less far than the next curve.
How do you build a 13-week cash flow forecast?
Start from the bank, not the books, and build forward one week at a time. The build has six moves, and none of them require software you do not already have.
- Open with the real balance. Pull today’s available cash across every operating account, net of checks already written that have not cleared. This is the only number in the model that is a fact. Everything after it is an estimate.
- Lay out 13 columns, one per week. Anchor them to the actual calendar, because the calendar is what creates the problem. A month with three payroll runs does not behave like a month with two.
- Enter receipts by expected collection date, not invoice date. Work from the accounts receivable aging, customer by customer, using how each one actually pays rather than the terms printed on the invoice. Your net-30 customer who reliably pays on day 52 goes in week eight.
- Enter disbursements by category, on their real dates. Payroll and payroll taxes, vendor payments, rent, insurance, sales and income tax remittances, and anything that leaves on a fixed schedule. Fixed-date items are the ones that break a company, precisely because they do not negotiate.
- Give debt service its own line. Do not bury it inside operating disbursements. It is the first line a lender looks for, and it is the line you need visible when you are deciding whether to take on more.
- Close each week to an ending balance, and set a floor. Decide the minimum cash you are willing to operate on, draw that line across the grid, and watch which weeks touch it.
Add one more column at the right edge for watchouts: the assumption in that week you are least sure about. That column is what turns the model from a spreadsheet into a management conversation.
| Row | What goes in it |
|---|---|
| Beginning cash | Prior week’s ending balance. Week one is the real bank balance, net of uncleared checks. |
| Customer receipts | Collections expected that week, taken from the AR aging by customer and by that customer’s actual payment behavior. |
| Other inflows | Deposits, refunds, asset sales, draws on an existing facility. Kept separate so operating performance stays legible. |
| Payroll and taxes | Gross payroll plus payroll tax remittances, on their actual run dates. Not averaged across the month. |
| Vendor payments | Scheduled AP by vendor, reflecting the terms you actually take rather than the terms you were offered. |
| Fixed operating costs | Rent, insurance, utilities, software, and anything else that leaves on a set day. |
| Debt service | Principal and interest on every facility, on its own line. This is the first row a lender reads. |
| Ending cash | Beginning plus inflows less outflows. The lowest value across all 13 weeks is the number that matters. |
| Watchouts | The single least certain assumption in that week, named in plain language. |
Free template
The 13-week forecast, already built
An Excel workbook with exactly the rows above already laid out. Set one date and one minimum-cash floor on the assumptions tab and the grid builds itself: thirteen week-ending columns anchored to the real calendar, each week closing to an ending balance, and any week that breaches your floor turning red on its own. Three tabs, being the forecast, your assumptions, and how to use it.
Name and email only. No cost, and nothing to unsubscribe from unless you want our insights.
Free template
13-Week Cash Flow Forecast
Tell us where to send it and your download will start straight away.
If you want a starting point you can edit rather than a blank page, this prompt will build the frame and, more usefully, interrogate your assumptions.
Treat the output as a draft to challenge, not an answer. The value of the exercise is in the questions it forces you to answer about your own collection behavior.
What does a lender actually read in it?
The lowest number, not the last one. A forecast that ends the quarter at a comfortable balance but dips below zero in week six describes a business that does not make it to the comfortable balance. Underwriters read for the trough first, then work outward. Five things get read closely:
- The minimum weekly ending balance and which week it falls in. This sizes the need. It is also the difference between a facility that solves the problem and one that merely funds it.
- Whether debt service sits on its own line. Buried debt service reads as either disorganization or reluctance, and neither helps. It also feeds directly into the coverage math, which we cover in our guide to calculating and improving your DSCR.
- Whether receipts are anchored to behavior or to invoicing. A forecast that assumes every customer pays on terms is a forecast nobody believes, including the person who built it.
- Whether it is current. Wall Street Prep notes that unlike monthly or annual models, “the 13-week cash flow must be updated weekly.” A model with a stale date on it says something about how the business is run.
- Whether variance is shown. Credibility comes from the gap between what you forecast last week and what actually happened, tracked openly over time. A forecast that has been consistently within a reasonable range is worth more than an optimistic one.
Worth being candid about where this tool earned its reputation. Financial Edge Training observes that “the primary purpose of a 13-week cash flow statement is during the bankruptcy process, but it is also used by companies seeking to placate lenders who are concerned about liquidity events and broken covenants.” Wall Street Prep goes further, noting that a credible model “can quite literally determine the outcome of an in-Court bankruptcy proceeding.”
That is precisely the argument for building one now. If the first 13-week forecast you ever produce is the one your lender requested after a covenant test went the wrong way, you are learning the tool and defending your business at the same time. Owners who already run the model tend to have a different conversation, because they arrive with a number and a date instead of a request.
What the forecast shows that a monthly P&L cannot
Timing inside the month. That is the entire delta, and it is larger than it sounds. A month that nets comfortably positive can still contain a week where payroll lands two days before a large customer settles. On a monthly view that week is invisible. It is averaged into a healthy number and disappears. On a weekly grid it is a specific date with a specific shortfall, which means it is a problem you can act on rather than one that arrives unannounced.
This is the operational counterpart to a structural question we have written about separately: where cash gets trapped in the working capital cycle explains why the gap exists in your business model, and it pairs with why profitable businesses still run out of cash. The 13-week forecast is how you see those forces arriving on the calendar, week by week, in time to do something about them.
Where does financing fit once you can see the trough?
Once the low week has a date and a dollar amount attached to it, the financing question changes shape. You are no longer asking how much you can borrow. You are asking what structure matches the gap you can now see, which is a far better question and a much shorter conversation. A trough that recurs every quarter calls for something different than a one-time gap created by a large order.
Capital Source structures financing through our affiliate, Stretch Finance, and through our network of lending partners. Availability and terms depend on business review and underwriting. What we will say is that a borrower who brings a current 13-week forecast to the table is a borrower we can have a more precise conversation with, because the forecast already answers many of the questions we would otherwise have to ask.
Bring us the forecast and we’ll lend against it
Tell us where your business is headed and where the cash gets tight. We would rather talk about the shape of the gap than a round number.
Key takeaways
- Thirteen weeks is one quarter, built week by week. The forecast projects actual cash receipts and disbursements on the dates they move, using the direct method rather than starting from net income.
- The median small business holds 27 cash buffer days. A 13-week horizon covers roughly three times that margin for error, which is why the window is long enough to be useful and short enough to be credible.
- Build from the bank balance and the AR aging, not the P&L. Enter receipts on the date each customer actually pays, and put every fixed-date obligation on its real date.
- Debt service belongs on its own line. It is the first row a lender reads, and it feeds the coverage math directly.
- The lowest week is the number that matters. A quarter that ends well can still contain a week that does not clear payroll, and only a weekly view exposes it.
- Build it before you need it. The model’s reputation was made in distressed situations, which is exactly why producing your first one under pressure is the hard way to learn it.
Frequently asked questions
What is a 13-week cash flow forecast?
A 13-week cash flow forecast is a week-by-week projection of the cash a business expects to actually receive and actually pay out over the coming quarter, built from expected receipts and disbursements rather than from accounting profit. It uses the direct method, meaning it tracks money in and money out on the dates it moves. Thirteen weeks is one fiscal quarter, or 91 days.
Why 13 weeks instead of 12 weeks or six months?
Thirteen weeks of seven days is 91 days, which lines up with a fiscal quarter. The window is long enough to reveal a seasonal or structural trough forming, and short enough that the inputs still rest on things you already know, such as which invoices are outstanding and when payroll runs. Longer horizons drift into assumption; shorter ones miss the trough.
Do I need a 13-week cash flow forecast if my business is profitable?
Profitability and liquidity are different questions. A month that nets comfortably positive can still contain a week where payroll lands before a large customer settles, and a monthly profit and loss statement averages that week out of view. The forecast exists to show timing inside the month, which is where most cash surprises originate.
What do lenders look for in a 13-week cash flow forecast?
The lowest weekly ending balance and the week it falls in, rather than the closing figure. Beyond that: whether debt service sits on its own line, whether receipts are anchored to how customers actually pay rather than to invoice terms, whether the model has been updated recently, and whether variance against prior forecasts is shown openly. Consistency over time carries more weight than optimism.
Sources
- Wall Street Prep, Demystifying the 13-Week Cash Flow Model in Excel.
- Financial Edge Training, 13-Week Cash Flow Model (TWCF).
- Deloitte, Roadmap: Statement of Cash Flows, Form and Content (ASC 230-10).
- JPMorgan Chase Institute, Cash Flows, Balances, and Buffer Days (September 2016; data from February to October 2015).
- Federal Reserve Banks, 2025 Report on Employer Firms, Small Business Credit Survey.
This article is for informational and educational purposes only and does not constitute financial, investment, accounting, tax, or legal advice. The concepts discussed are general in nature and should be reviewed with qualified professionals based on your specific circumstances. Capital Source provides access to commercial financing solutions through its affiliates, syndicates, network of banks, lending partners, and private credit funds/groups. Availability, approval, funding amount, structure, and terms are subject to business review, underwriting, and lender approval.