
Cash Flow vs. EBITDA: Why a Profitable Business Can Still Run Dry
A strong EBITDA number can sit right next to an empty bank account. If you have ever looked at a healthy earnings figure and then struggled to pay a vendor, the problem is not your business. It is that EBITDA and cash are two different things, and knowing the difference is what keeps a profitable company solvent.
The cash flow vs EBITDA distinction is one every owner should master, because EBITDA is the metric everyone reaches for to describe how a business is doing. For good reason: it strips out the noise and shows the underlying earning power of operations. But it is not money in the bank, and treating it as if it were is one of the most expensive mistakes an owner can make. We see it often at Capital Source. A founder quotes a confident EBITDA figure, then in the same breath mentions that payroll was tight last week. Both can be true at once. This is the metric companion to our piece on why profitable businesses run out of cash: that article told the cash-cycle story, this one defines the numbers you use to read it, and shows why lenders and equity sponsors read them differently.
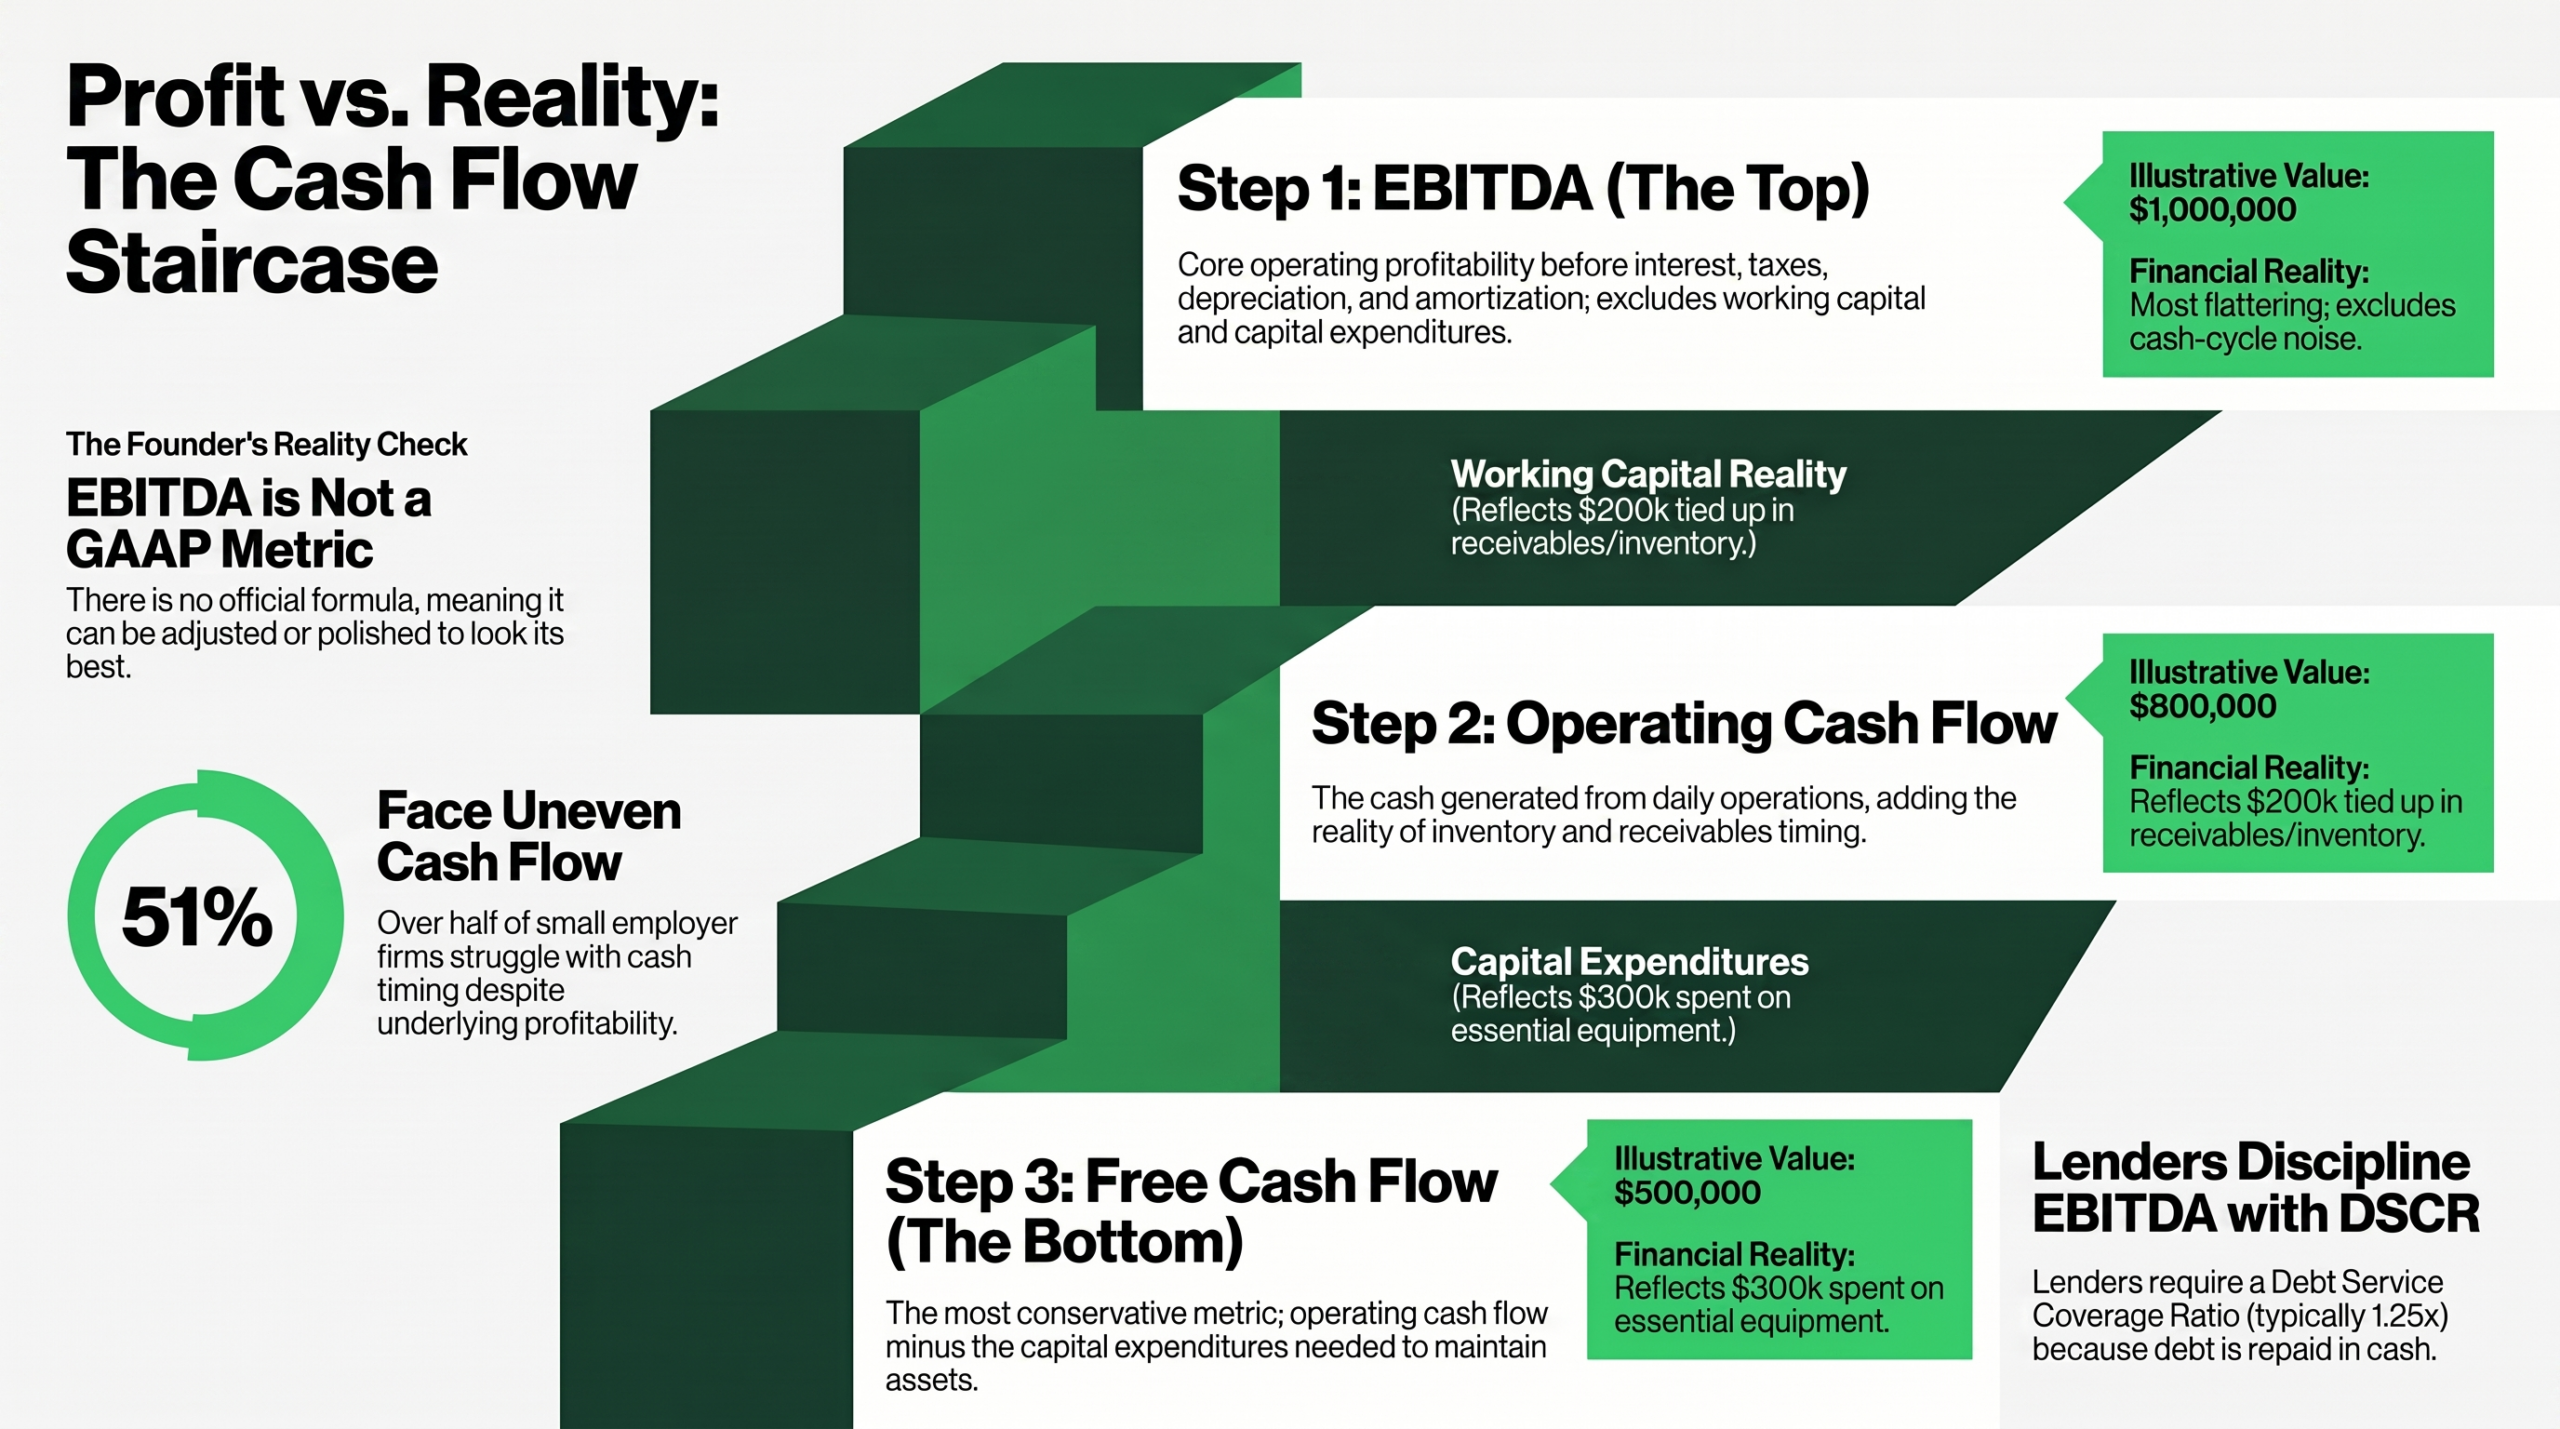
In the Federal Reserve Banks’ 2024 Small Business Credit Survey, 51% of small employer firms named uneven cash flow as a financial challenge, while 75% cited rising costs and 56% cited paying operating expenses. Source: Federal Reserve Banks, 2025 Report on Employer Firms.
What is EBITDA, and what does it leave out?
EBITDA is earnings before interest, taxes, depreciation, and amortization, a measure of a business’s core operating profitability before financing and accounting decisions are layered on. You calculate it by taking net income and adding back interest, taxes, depreciation, and amortization (EBITDA = Net Income + Interest + Taxes + D&A), per the framework used by Wall Street Prep. The idea is to see how the operation earns before two companies with different debt loads, tax situations, or asset histories are compared.
What EBITDA leaves out is exactly what gets owners into trouble. It ignores the cash you spend on capital expenditures to keep the business running, and it ignores changes in working capital, the money locked up in inventory and receivables. It also adds back depreciation and amortization, which are real costs of assets you actually bought, just spread over time. So EBITDA can climb while your bank balance falls, because none of those cash realities touch the EBITDA line.
One point matters more than any other here: EBITDA is not a metric defined under GAAP or IFRS. There is no single official formula, which means two companies (or two advisors) can calculate it differently and both be defensible. That flexibility is why EBITDA is useful as a quick proxy, and also why it can be managed, polished, and presented to look its best. Keep that in mind every time you see the number.
What is operating cash flow, and how is it different from EBITDA?
Operating cash flow is the actual cash a business generates from its day-to-day operations over a period, drawn from the cash flow statement rather than the income statement. You build it from net income, add back non-cash items like depreciation and amortization, and then adjust for changes in working capital (OCF = Net Income + non-cash items +/- changes in working capital), following the structure laid out by the Corporate Finance Institute. The crucial addition over EBITDA is that working-capital line.
That single difference is where the gap between earnings and cash opens up. If your customers are paying slowly and your receivables balloon, EBITDA does not notice, but operating cash flow drops, because the cash never arrived. If you are stocking up on inventory ahead of a busy season, EBITDA shrugs, but operating cash flow falls, because the money went out the door. Operating cash flow reflects the timing of money the way EBITDA never can. When the two diverge sharply and persistently, it is a signal worth understanding rather than ignoring, and it usually traces back to the cash conversion cycle we covered in the companion post.
In a 2018 Intuit/Wakefield study, 61% of small businesses reported struggling with cash flow, and 32% said they had been unable to pay vendors, loans, or themselves at some point. Source: Intuit/QuickBooks (Wakefield Research study, released February 2019).
What is free cash flow, and why do lenders care about it?
Free cash flow is the cash a business has left after funding both its operations and the capital expenditures needed to maintain and grow the asset base. The formula steps down directly from operating cash flow: free cash flow equals operating cash flow minus capital expenditures (FCF = OCF – CapEx), again per the Corporate Finance Institute. It is the truest answer to the question every owner and every lender is really asking: after everything the business needs to keep running, how much cash is actually free?
Lenders care about free cash flow because debt is repaid in cash, not in earnings. EBITDA might tell them the operation is profitable in principle, but free cash flow tells them whether there is real money available to service a loan after the business has fed itself. A company with strong EBITDA and heavy capital needs can have very little free cash flow, and that is precisely the kind of business that looks fundable on a summary sheet yet strains under a repayment schedule. The cash, not the earnings, does the repaying.
The hierarchy: how EBITDA, OCF, and FCF stack up
Think of the three metrics as a descending staircase, each step closer to the cash you can actually touch. EBITDA sits at the top and is the most flattering, because it excludes working-capital changes and capital expenditures entirely. Operating cash flow is the next step down, because it pulls in the working-capital reality that EBITDA ignores. Free cash flow is the bottom step and the most conservative, because it then deducts the capital expenditures the business cannot avoid.
Here is the staircase with illustrative numbers, not sourced figures, just to show the mechanics. Say EBITDA is $1 million. Now say the business tied up $200,000 in additional receivables and inventory this year, so operating cash flow comes in around $800,000. Then say it spent $300,000 on equipment it genuinely needed, so free cash flow lands near $500,000. Same business, same year, three very different numbers. The owner who only quotes the $1 million figure and the lender who only looks at the $500,000 figure are both right, and they are describing the same company. (These are illustrative figures to show the relationship, not Capital Source data.)
Why “adjusted EBITDA” can be even further from your bank balance
Adjusted EBITDA is EBITDA with additional items added back to it, things like stock-based compensation, one-time or non-recurring expenses, and owner-specific costs, intended to show “normalized” earning power. It is common, often legitimate, and routinely how a business is presented when it is being valued or sold. But none of those add-backs put a single dollar into the bank account. Adding back stock-based compensation does not reduce what you owe your suppliers, and labeling an expense “one-time” does not refund the cash you already spent.
This is why diligence exists. A quality-of-earnings analysis is the independent review that verifies a company’s reported and adjusted earnings during diligence, testing whether each add-back is truly non-recurring and whether the earnings are sustainable and backed by cash. The whole purpose is to separate earnings that are real and durable from earnings that look good on a slide. When you understand what a quality-of-earnings review is checking, you understand why a sophisticated buyer or lender never takes adjusted EBITDA at face value.
Why lenders and equity sponsors read these numbers differently
Lenders and equity sponsors use the same metrics with opposite incentives, and knowing which lens is on you changes how you present your business. Equity sponsors are generally motivated to maximize EBITDA, because purchase price and the amount of debt a deal can carry are often expressed as a multiple of EBITDA, so a higher number supports a higher valuation and more leverage. Lenders accept EBITDA as a convenient starting proxy for earning power, then deliberately discipline it, because they are not buying upside, they are getting repaid in cash on a schedule.
The tool lenders use to impose that discipline is the debt service coverage ratio. DSCR measures whether a business generates enough cash to cover its debt obligations, and lenders typically look for a ratio of at least 1.25x, while a DSCR below 1.0x means annual debt obligations exceed the cash available to pay them, according to the Corporate Finance Institute. DSCR is where EBITDA stops being the headline and cash takes over, because you cannot pay a loan with a multiple, you pay it with money.
Lenders typically want a DSCR of at least 1.25x. A DSCR below 1.0x means a business’s annual debt obligations exceed the cash it has available to service them. Source: Corporate Finance Institute.
How Capital Source structures around the real cash, not just the metric
Capital Source structures financing around how your cash actually moves, not around a single flattering number on a summary sheet. We use EBITDA the way a lender should, as a starting read on earning power, and then we look past it to operating cash flow, free cash flow, and the cash conversion cycle to understand what your business can really support. We design capital around the deal, which means starting with the reality of your receivables, inventory, seasonality, and capital needs. Financing is offered through our affiliate, Stretch Finance, and the structures below are built to address the gap between strong earnings and available cash.
Every business reads differently across these three numbers, so the right structure depends on yours. Our Deal Desk’s job is to understand where your cash actually lives and structure capital around it. If you want to dig deeper into the cash-cycle side of this, our working capital resources are a good next stop.
When your EBITDA and your bank balance disagree
A strong earnings number that does not show up as cash is a structuring problem, and structuring is what we do. Tell us how your cash actually moves and we will design capital around it.
Key takeaways
- EBITDA is not cash. It measures core operating earnings before interest, taxes, depreciation, and amortization, and it excludes both working-capital changes and capital expenditures.
- EBITDA is not a GAAP or IFRS metric. There is no single official formula, which is precisely why it can be calculated favorably and managed.
- The metrics form a staircase. EBITDA is highest, operating cash flow steps down by adding working-capital reality, and free cash flow steps down again by deducting capex.
- Adjusted EBITDA moves further from the bank. Add-backs like stock-based compensation and one-time items normalize earnings on paper but add no cash, which is why quality-of-earnings reviews exist.
- Lenders discipline EBITDA with DSCR. Equity sponsors maximize EBITDA for valuation; lenders accept it as a proxy and then test for at least a 1.25x debt service coverage ratio, because debt is repaid in cash (Corporate Finance Institute).
Frequently asked questions
What is the difference between EBITDA and cash flow?
EBITDA measures core operating earnings before interest, taxes, depreciation, and amortization, and it excludes changes in working capital and capital expenditures. Operating cash flow is the actual cash generated from operations and does include working-capital changes, while free cash flow goes a step further by deducting capex. So EBITDA can rise while cash flow falls, because EBITDA ignores the timing of money that cash flow captures.
Is EBITDA a GAAP metric?
No. EBITDA is not defined under GAAP or IFRS, so there is no single official formula for it. Two companies or advisors can calculate it differently and both be defensible, which is part of why it can be presented favorably and should never be treated as a substitute for cash.
Why do lenders care more about cash flow than EBITDA?
Lenders care about cash flow because debt is repaid in cash, not in earnings. EBITDA can show a business is profitable in principle, but free cash flow shows whether there is real money left to service a loan after the business funds its operations and necessary capital expenditures. That is why lenders discipline EBITDA with measures like the debt service coverage ratio.
What is a good debt service coverage ratio?
Lenders typically look for a debt service coverage ratio of at least 1.25x, meaning the business generates noticeably more cash than its annual debt obligations require, according to the Corporate Finance Institute. A DSCR below 1.0x means annual debt obligations exceed the cash available to pay them.
What is adjusted EBITDA, and why is it used?
Adjusted EBITDA is EBITDA with additional items added back, such as stock-based compensation, one-time expenses, and owner-specific costs, to show normalized earning power. It is common in valuations and sales, but none of those add-backs put cash in the bank, which is why a quality-of-earnings review tests whether the adjustments and earnings are real and sustainable.
Sources
- Corporate Finance Institute, Cash Flow Guide: EBITDA, CF, FCF, FCFE, FCFF.
- Corporate Finance Institute, Debt Service Coverage Ratio (DSCR).
- Wall Street Prep, EBITDA.
- Wall Street Prep, EBITDA vs. Cash Flow.
- Federal Reserve Banks, 2025 Report on Employer Firms (2024 Small Business Credit Survey).
- Fed Communities, 2024 Small Business Credit Survey: Key Insights.
- Intuit QuickBooks, QuickBooks Study: Cash Flow Woes (Wakefield Research, 2018/2019).
This article is for informational and educational purposes only and does not constitute financial, investment, accounting, tax, or legal advice. The concepts and formulas discussed are general in nature, and EBITDA in particular is not a standardized GAAP or IFRS measure; review your specific circumstances with qualified professionals. Figures are drawn from the sources listed and are current as of their respective reporting periods. Capital Source provides access to commercial financing solutions through its affiliates, syndicates, network of banks, lending partners, and private credit funds/groups. Availability, approval, funding amount, structure, and terms are subject to business review, underwriting, and lender approval.